This guide describes the current appliance. Availability, vendor features and access depend on your device firmware and Windows policies. Screenshots use the development UI with fictional addresses, users and device names; they contain no customer inventory.
01 What Device Tracker can establish #
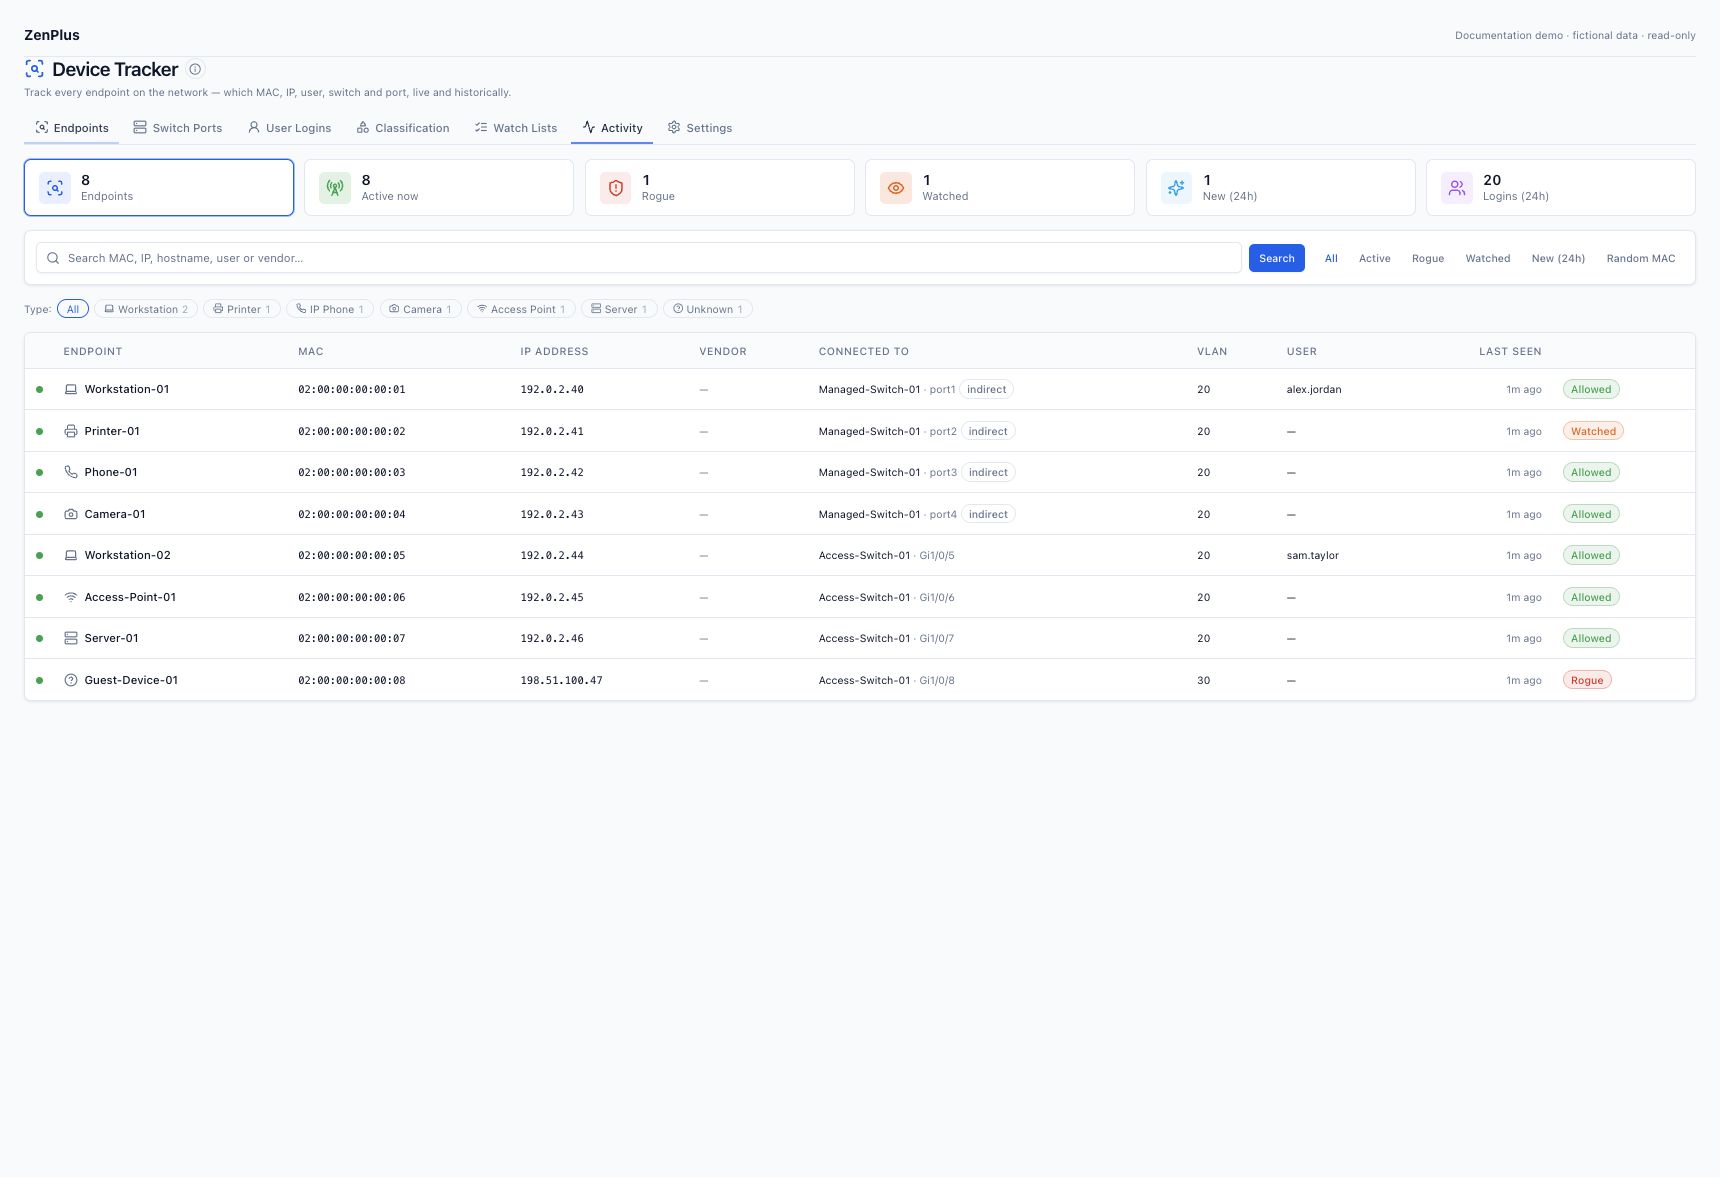
Device Tracker joins switch forwarding observations, gateway address observations and optional domain-controller authentication events. A MAC identifies an observed network interface; an IP address, port or username is evidence associated with it at a time. Coverage depends on the devices and contexts you collect.
| Question | Where to work | Evidence to check |
|---|---|---|
| Where was an endpoint observed? | Endpoints and endpoint details | Search MAC / IP / hostname, then check the attachment label and observation time. |
| Which endpoints are on this port? | Switch Ports | Select a switch and click the endpoint count; the resulting list keeps the switch and port filter. |
| Who authenticated from that address? | User Logins | Event time and address history; shared addresses may remain unassigned. |
| What changed? | Activity | New, moved, watch and rogue observations; match the event to its collection time. |
| What is approved? | Watch Lists | Your enabled allow / watch / ignore rules; rogue is a policy result. |
02 First-time deployment checklist #
Plan the collection scope
Identify access switches, VLAN-routing gateways, controller-managed switches and optional DCs. Record model, firmware, management address and relevant VLAN / VDOM / VRF. Use the setup guide to provision access.
Prove read access
Test interface and forwarding tables with the same account used by the appliance. Test a relevant gateway neighbour table. A successful interface query alone does not prove MAC-table access.
Enable collection
Add monitored devices and their credentials; open Device Tracker → Settings, enable UDT and select overrides only where necessary. Start with the default 300-second interval.
Validate one known endpoint
Generate ordinary network traffic from an approved test workstation. Allow two polling cycles, then compare its MAC, address, VLAN and expected switch port with source-device read output.
Add optional Microsoft activity
Follow the dedicated Microsoft account guide. Use Poll now, then check controller status and event-to-endpoint evidence.
Apply policy and alerts
Review classification and allow rules before enabling rogue or watch alerts. Use an approved test endpoint and notification channel; do not disable production ports to test discovery.
A known test endpoint has fresh, correctly scoped MAC/port observations; its IP reporter is visible; any user association has a matching event-time address. Missing data remains unknown rather than becoming an invented attachment.
03 The seven workspace tabs #
| Tab | Operator task |
|---|---|
| Endpoints | Search inventory and open attachment, address and event history. |
| Switch Ports | View direct and controller-managed switch inventory, status and observed endpoints per port. |
| User Logins | Inspect authentication activity and correlated endpoints. Requires user-data permission. |
| Classification | Assign meaningful endpoint types with automatic, rule or manual classification. |
| Watch Lists | Manage allow, watch and ignore policies. |
| Activity | Investigate collection-derived changes over the selected time range. |
| Settings | Set polling intervals, credential overrides and domain controllers. |
The current workspace is titled Device Tracker, at /udt. Screen labels may differ on older releases.
04 How observations become a tracked endpoint #
| Source | Contributes | Does not prove |
|---|---|---|
| Access-switch forwarding table | MAC → bridge port → interface; VLAN when available. | The IP address or authenticated user by itself. |
| Gateway ARP / neighbour table | IP → MAC, reporter and routed interface. | A physical access-switch port. |
| FortiGate switch-controller inventory + diagnostics | Managed-switch identities, local ports, link state and observed MAC locations. | Direct endpoint attachment when access/uplink classification is unconfirmed. |
| Selected DC Security logs | Successful authentication activity with event time and client address when present. | Continuous desktop ownership or a reliable mapping behind a shared/proxy address. |
SNMP is the primary source. Enabled SSH collection can supplement missing gateway or managed-switch evidence using fixed read commands. New or replacement address evidence is confirmed over repeated observations; an overlapping address remains visible as a conflict.
05 Read location and freshness correctly #
| Label / signal | Interpretation |
|---|---|
| Direct | Observed on a port classified as access. Check topology: a phone, AP, hypervisor or unmanaged bridge can still sit behind it. |
| Indirect | An uplink / trunk or an observation that is not established as a direct attachment. |
| Observed port / unconfirmed | Controller-reported MAC location. Useful evidence, but not a confirmed endpoint access port. |
| Gateway evidence | An address reporter without a confirmed switch attachment. |
| Active now | Seen in the last 15 minutes; not a separate reachability test or a promise that the endpoint is powered on. |
| Unknown link state | The source did not provide a supported operational state. Do not count it as available capacity. |
A forwarding table can retain an old MAC after a move. Collection is periodic; attachment gaps of 15 minutes expire current state while retaining historical periods. Review all sightings and their timestamps before deciding a port is wrong.
06 Retention and polling performance #
Default UDT housekeeping retains closed attachment periods, address history, activity and user login history for 90 days. Endpoint identities and daily capacity records are retained separately. Check the appliance Storage page and your approved retention policy; this guide does not promise indefinite historical data.
Begin at 300 seconds. Shorten intervals for selected sources after measuring collection duration, timeout rates and Windows event volume. Keep the effective interval below the 15-minute active window if you need continuous active-state coverage. A very long interval can make a healthy endpoint appear inactive between polls. Page and filter large inventories instead of repeatedly loading every endpoint.
07 Permission boundaries #
| Capability | Minimum permission | Not required |
|---|---|---|
| Endpoint and port discovery | SNMP read view on the relevant interface, forwarding and neighbour tables; appliance-source ACL. | SNMP write, network configuration changes. |
| Supplemental gateway / controller evidence | Optional SSH operational read commands in the actual routing/controller context. | Configuration backup account replacement, blanket administrator access. |
| Windows Security events | Dedicated domain user with Security-channel read rights, plus WinRM remote-shell execution rights on selected DCs. | Domain Admin, Enterprise Admin, AD writes or permission to clear logs. |
| Appliance inventory access | udt.view. | Access to user activity. |
| Usernames and login activity | udt.view_users or udt.manage. | Sharing user activity with every inventory viewer. |
| Configuration / port actions | udt.manage; direct-switch actions additionally require a deliberately provisioned write-capable SNMP credential. | Write access for normal discovery; controller-child port actions. |