Network monitoring
Network monitoring built for live operations
ZenPlus brings devices, links, availability, service checks, discovery, and interface drill-downs into one fast NOC workspace.
What you get
What this ZenPlus module gives your operations team
Purpose-built workflows that map to how operators actually work — not a placeholder surface, but a real, documented part of the ZenPlus console.
- Device inventory with type, status, location, uptime, and quick actions
- Availability command center for devices, services, servers, sites, groups, and types
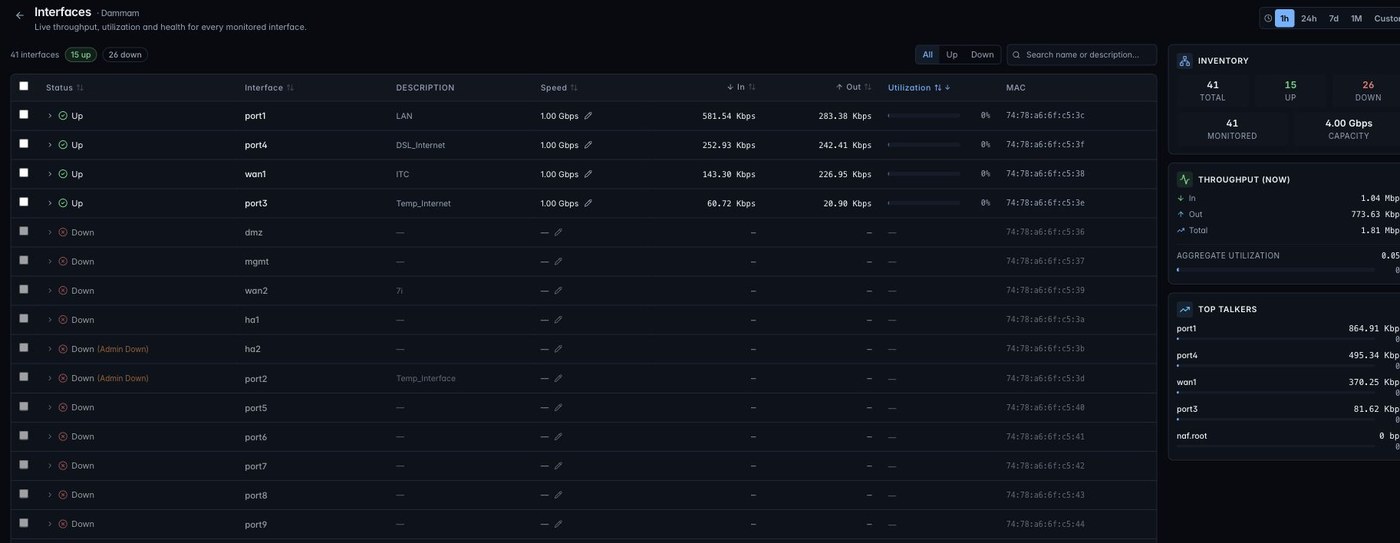
- Interface utilization with link ranking, high-utilization filters, and traffic context
- Network discovery profiles to scan scopes, apply credentials, and import monitored assets
- Dedicated <a href="/zenplus/snmp-network-monitoring/">SNMP network monitoring</a> feature page for SNMPv2c/v3, per-device licensing, and on-prem credentials
Live-system proof
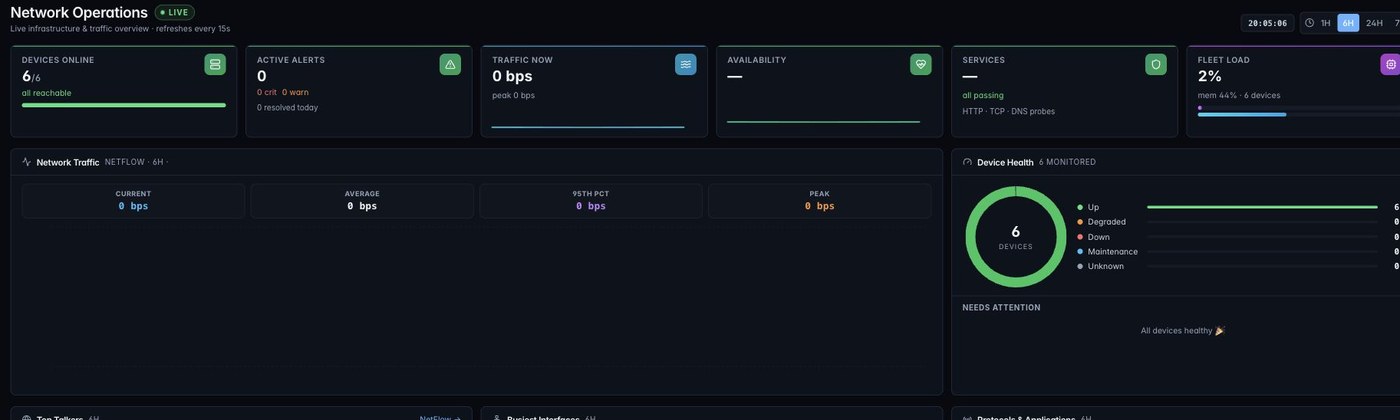
- Live dashboard page captured with Devices Online, Active Alerts, Traffic Now, Availability, Services, and Fleet Load.
- Device detail page captured with Performance Overview, Interface Status, Health Score, inventory, events, and quick actions.
Capabilities
Everything in Network monitoring, organized the way you operate
Each group below is a working area of the module — from day-one setup to deep operational drill-downs.
Monitoring menu coverage
- Devices: search, filter, export, add devices, and inspect health by status, type, and location
- Link Utilization: rank interfaces by utilization and sort by health or bandwidth pressure
- Availability: SLA-style fleet status with outage timelines, site matrices, and service availability
- Services: HTTP, TCP, and DNS checks with group, level, status, and type filters
- Discovery: profile-based scans for automated import and classification
Device drill-downs
- CPU, memory, interface utilization, latency, packet loss, and uptime tiles
- Availability timeline with up/down history for the selected window
- Interface table with speed, inbound/outbound throughput, errors, and utilization
- Diagnostics, console access, config backup action, and recent activity in one place
In the product
A closer look at Network monitoring
Continue exploring
The ZenPlus module menu
Each page below maps to a real product surface in the unified ZenPlus console.
Network Monitoring
Devices, availability, services, link utilization, discovery, and interface health.
ExploreSNMP Network Monitoring
SNMPv2c/v3 polling, interface metrics, per-device licensing, and on-prem credentials.
ExploreNetFlow Analytics
Top talkers, endpoints, protocols, QoS, traffic throughput, and flow incidents.
ExploreServer Monitoring
Inventory, agent fleet, collection policies, resource pressure, and software baselines.
ExploreApplication Performance
OpenTelemetry services, service maps, grouped errors, traces, and ingest keys.
ExploreNetwork Maps
Network Studio, manual maps, design mode, live mode, and topology context.
ExploreAlerting
Alert Center, alert rules, traps, channels, gateways, and incident routing.
ExploreConfiguration & NCM
Config backup, connection profiles, SNMP credentials, Windows credentials, and MIBs.
ExploreReports
Executive dashboards, availability trends, top issues, outages, and export workflows.
ExploreNext step
See Network monitoring in a live ZenPlus demo.
Review the product screens, module workflow, deployment model, and NOC use cases with the Zentryc team.