NetFlow analytics
NetFlow analytics that turn traffic into answers
Inspect throughput, sessions, top talkers, applications, protocols, conversations, QoS, TCP flags, and network class mix without leaving the monitoring console.
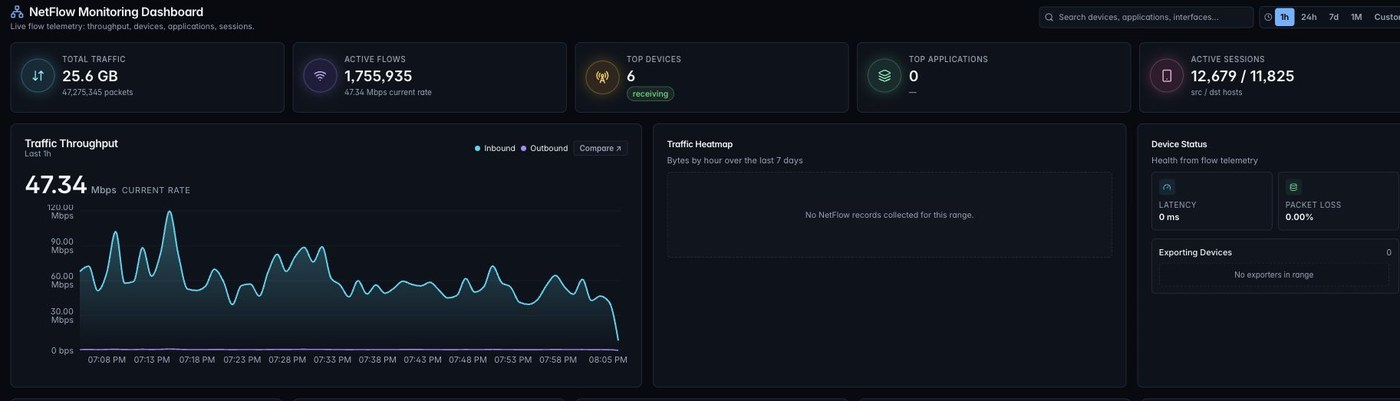
What you get
What this ZenPlus module gives your operations team
Purpose-built workflows that map to how operators actually work — not a placeholder surface, but a real, documented part of the ZenPlus console.
- Traffic throughput chart with inbound/outbound trends and current rate
- Top talkers, endpoints, applications, protocols, and conversations
- Recent flow records with source, destination, application, protocol, bytes, packets, and status
- Incident signals for unusual volume, throughput health, or exporter behavior
Live-system proof
- The captured NetFlow page includes Total Traffic, Active Flows, Top Devices, Active Sessions, Traffic Throughput, Heatmap, Protocol Distribution, QoS Classes, TCP Flags, and Alerts.
Capabilities
Everything in NetFlow analytics, organized the way you operate
Each group below is a working area of the module — from day-one setup to deep operational drill-downs.
Traffic investigation
- Search devices, applications, and interfaces from the NetFlow console
- Compare traffic windows and move from 1 hour to 1 month without rebuilding the view
- Classify public/private traffic and inspect QoS/DSCP behavior
- Spot active sessions and noisy endpoints before users feel saturation
Capacity and performance
- Use 95th percentile, current rate, average, and peak context for bandwidth planning
- Rank top interfaces across exporters to identify congested paths
- Combine flow data with device health and link utilization for faster root cause analysis
Continue exploring
The ZenPlus module menu
Each page below maps to a real product surface in the unified ZenPlus console.
Network Monitoring
Devices, availability, services, link utilization, discovery, and interface health.
ExploreSNMP Network Monitoring
SNMPv2c/v3 polling, interface metrics, per-device licensing, and on-prem credentials.
ExploreNetFlow Analytics
Top talkers, endpoints, protocols, QoS, traffic throughput, and flow incidents.
ExploreServer Monitoring
Inventory, agent fleet, collection policies, resource pressure, and software baselines.
ExploreApplication Performance
OpenTelemetry services, service maps, grouped errors, traces, and ingest keys.
ExploreNetwork Maps
Network Studio, manual maps, design mode, live mode, and topology context.
ExploreAlerting
Alert Center, alert rules, traps, channels, gateways, and incident routing.
ExploreConfiguration & NCM
Config backup, connection profiles, SNMP credentials, Windows credentials, and MIBs.
ExploreReports
Executive dashboards, availability trends, top issues, outages, and export workflows.
ExploreNext step
See NetFlow analytics in a live ZenPlus demo.
Review the product screens, module workflow, deployment model, and NOC use cases with the Zentryc team.