01 Start here #
APM is application tracing. The ZenPlus Agent already monitors the server—CPU, memory, disks, processes, services and Windows events. APM adds the application view: requests, errors, latency, dependencies and distributed traces.
Application → local ZenPlus Agent gateway → appliance. No application ingest key is required.
Application → appliance directly. Use this when no ZenPlus Agent is installed on the application host.
Use OTLP/HTTP protobuf on port 4318. gRPC is available locally on 4317.
Installing the ZenPlus Agent does not automatically create application traces. Enable its APM gateway, then enable OpenTelemetry in the application runtime.
How to read the examples in this guide
Configuration blocks are templates. Copy the relevant lines, then replace the values marked below before restarting the application.
| Example value | What to do | Reason |
|---|---|---|
REPLACE_WITH_SERVICE_NAME | Always change. Use a stable name such as customer-portal. | This is the name shown in APM. |
REPLACE_WITH_ENVIRONMENT | Always change. Use prod, staging or test. | It separates telemetry from different environments. |
REPLACE_WITH_VERSION | Change for each release, for example 2.4.1. | It identifies the deployed application version. |
http://127.0.0.1:4318/v1/traces | Keep only when the Agent is on the same server. | 127.0.0.1 always means the local computer. |
otlp, http/protobuf, none | Keep as shown for the recommended traces-only setup. | These select the supported exporter and protocol. |
... | Never paste it. | It only means that unrelated existing configuration was omitted from the example. |
02 How APM works #
Recommended: through the local Agent
User request
    ↓
IIS / Nginx / Apache
    ↓
Application runtime + OpenTelemetry
    ↓  OTLP/HTTP protobuf
127.0.0.1:4318  (ZenPlus Agent gateway)
    ↓  authenticated forwarding
ZenPlus appliance /v1/traces
    ↓
Overview → Services → Traces → Errors → Service Map
The gateway listens only on loopback by default, automatically manages its APM credential, buffers short interruptions, and forwards telemetry to the appliance.
Nginx, Apache and IIS are entry points—not the business application. Instrument the application runtime behind the web server: .NET, Java, Node.js, Python, PHP or another OpenTelemetry-supported runtime.
03 Read the APM Overview #
Open Applications → Overview. Start here during an incident. The selected time window in the upper-right controls every tile and chart.
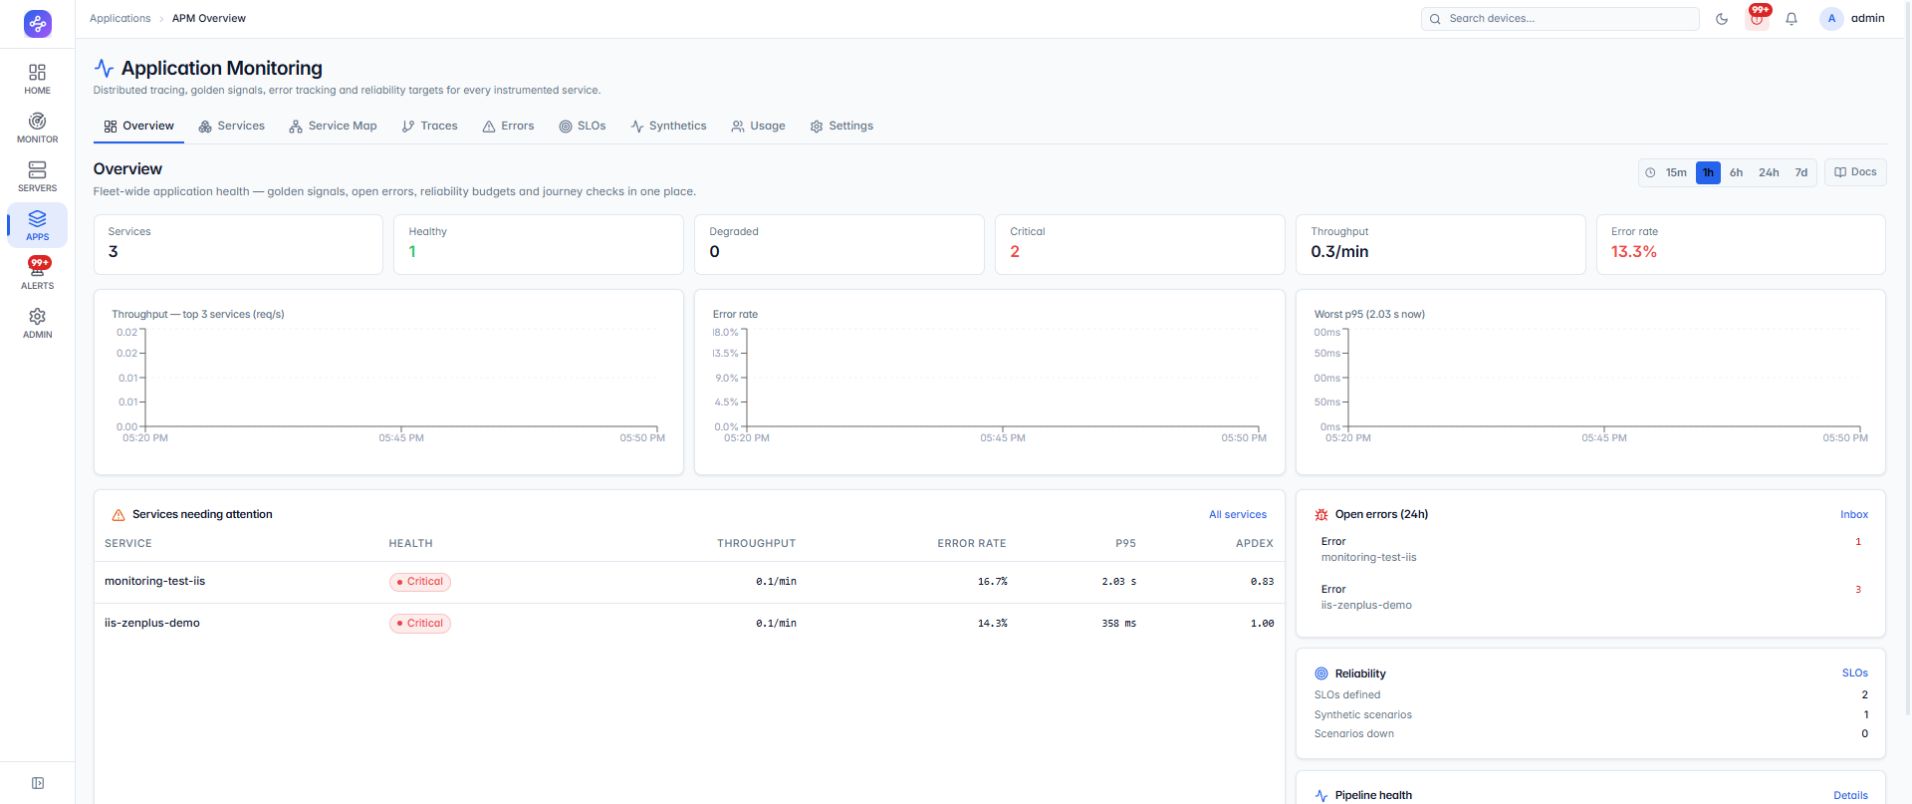
| Item | What it tells you | First action |
|---|---|---|
| Services | How many instrumented services sent requests in the selected window. | If zero, check instrumentation and gateway health. |
| Healthy / Degraded / Critical | Current service health calculated from request errors and latency. | Open the affected service. |
| Throughput | Inbound application requests per minute. | Compare with the normal traffic pattern. |
| Error rate | Percentage of inbound requests that failed. | Open Errors, then an example trace. |
| Worst p95 | The service with the slowest 95th-percentile response time. | Open its slowest trace waterfall. |
| Pipeline health | Whether the appliance is receiving and processing telemetry. | Check Settings → Data quality. |
04 Enable the ZenPlus Agent gateway #
Use the Agent gateway when the application and ZenPlus Agent run on the same server. This is the simplest and safest deployment.
Install and enroll the Agent
The server must appear online under Servers. Complete the normal Agent enrollment before enabling APM.
Enable APM capability
Enable APM in the Agent policy or configuration and select the environment, normally prod, staging or test.
Restart the Agent
The Agent starts the local OTLP gateway and automatically enrolls an appliance-side APM credential.
Verify the listeners
Confirm the Agent owns loopback ports 4317 and 4318.
Agent configuration example
Copy this into the Agent configuration only if the APM capability is not managed by policy. Change environment for the server. Keep both listen addresses on 127.0.0.1 when applications run on the same host.
apm:
  enabled: true
  environment: prod
  grpc_listen: 127.0.0.1:4317
  http_listen: 127.0.0.1:4318
  spool_max_bytes: 536870912
  max_request_bytes: 16777216
Verify on Windows
Get-Service ZenPlusAgent
Get-NetTCPConnection -State Listen -LocalPort 4317,4318 |
  Select-Object LocalAddress,LocalPort,OwningProcess
Verify on Linux
sudo systemctl status zenplus-agent --no-pager
sudo ss -lntp | grep -E '127\.0\.0\.1:(4317|4318)'Do not expose 4317 or 4318 to the network when the application is local. Loopback access needs no inbound firewall rule and keeps the Agent credential out of the application configuration.
05 Configure IIS and .NET #
This method instruments ASP.NET on IIS without changing application source code. Run Windows PowerShell 5.1 as Administrator.
1. Find the correct Web.config
Web.config is normally in the physical root folder of the IIS site or application. Do not edit applicationHost.config, machine.config, or a different website’s file.
- Open IIS Manager.
- In Connections, expand the server and Sites.
- Select the exact website or application you want to monitor. If the application is under Default Web Site, select the application—not only its parent website.
- In the right Actions pane, select Basic Settings.
- Read the Physical path. That folder is where you look for
Web.config.
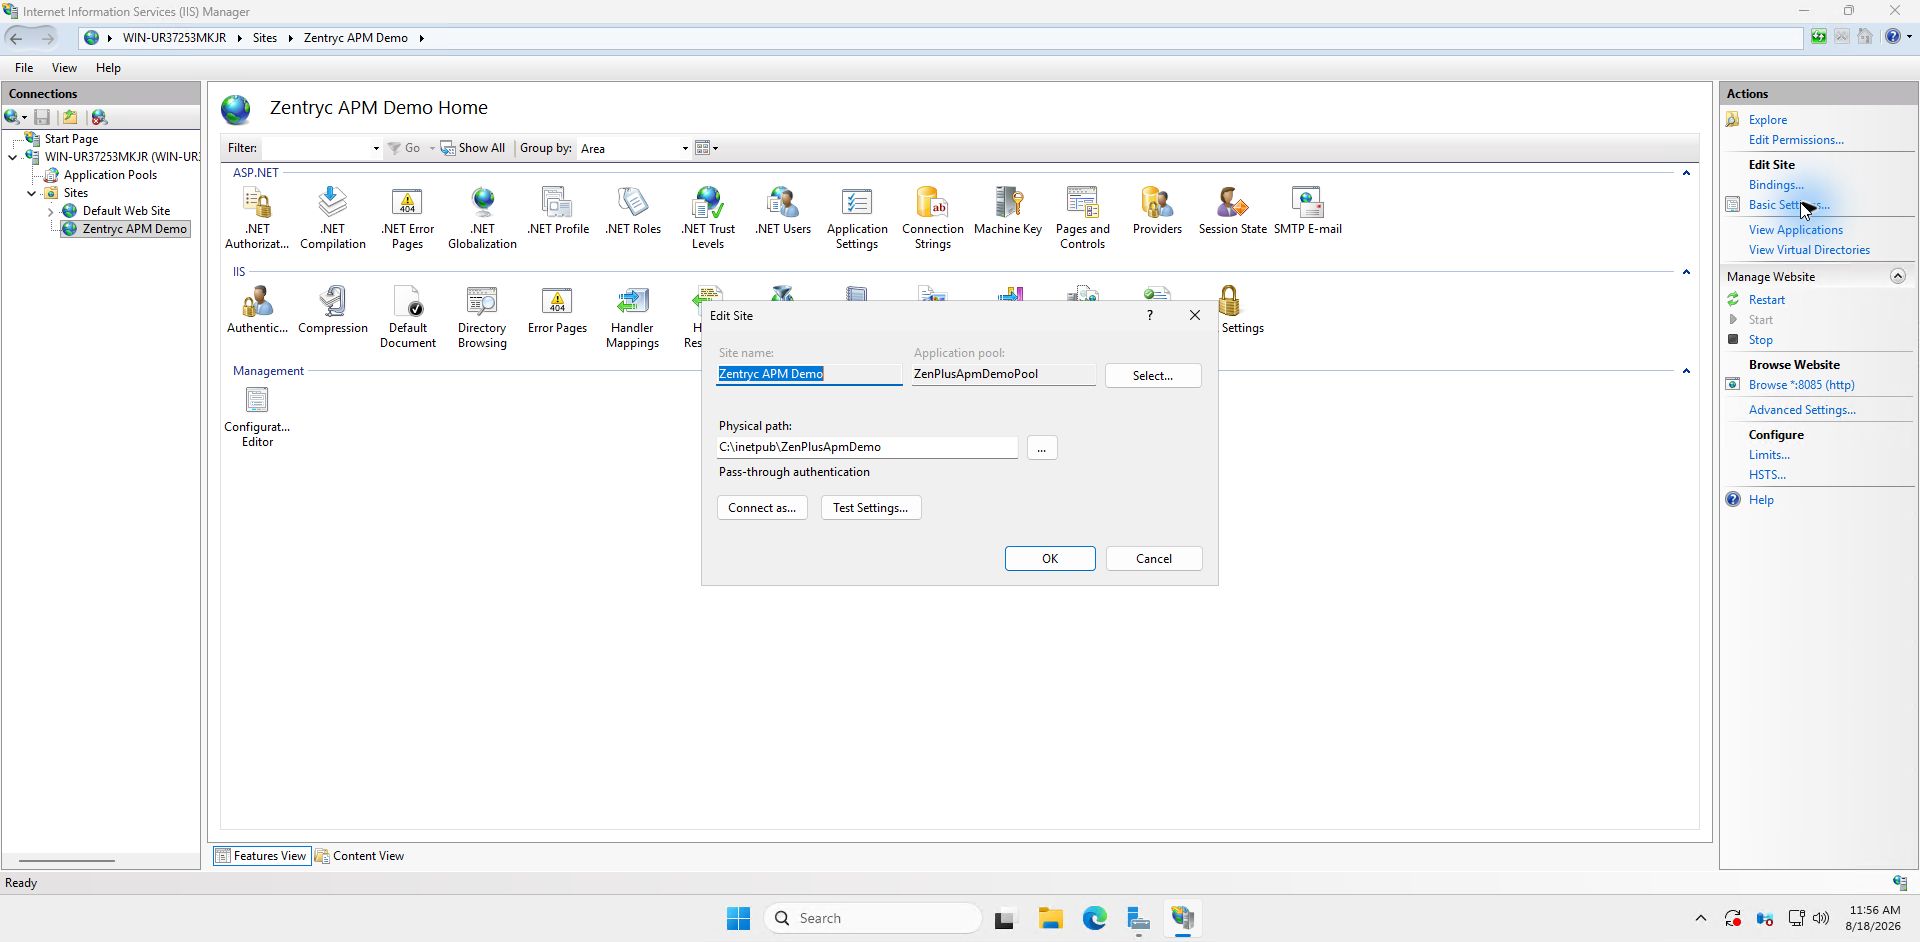
C:\inetpub\ZenPlusApmDemo. Your path will normally be different. Select the image to open it at full size.- Close Basic Settings without changing it, then select Explore in the Actions pane.
- In the opened folder, locate
Web.config. Windows may display it asweb.config; file-name capitalization does not matter. - Make a backup copy before editing. Open the file with an administrator text editor only when the folder permissions require it.
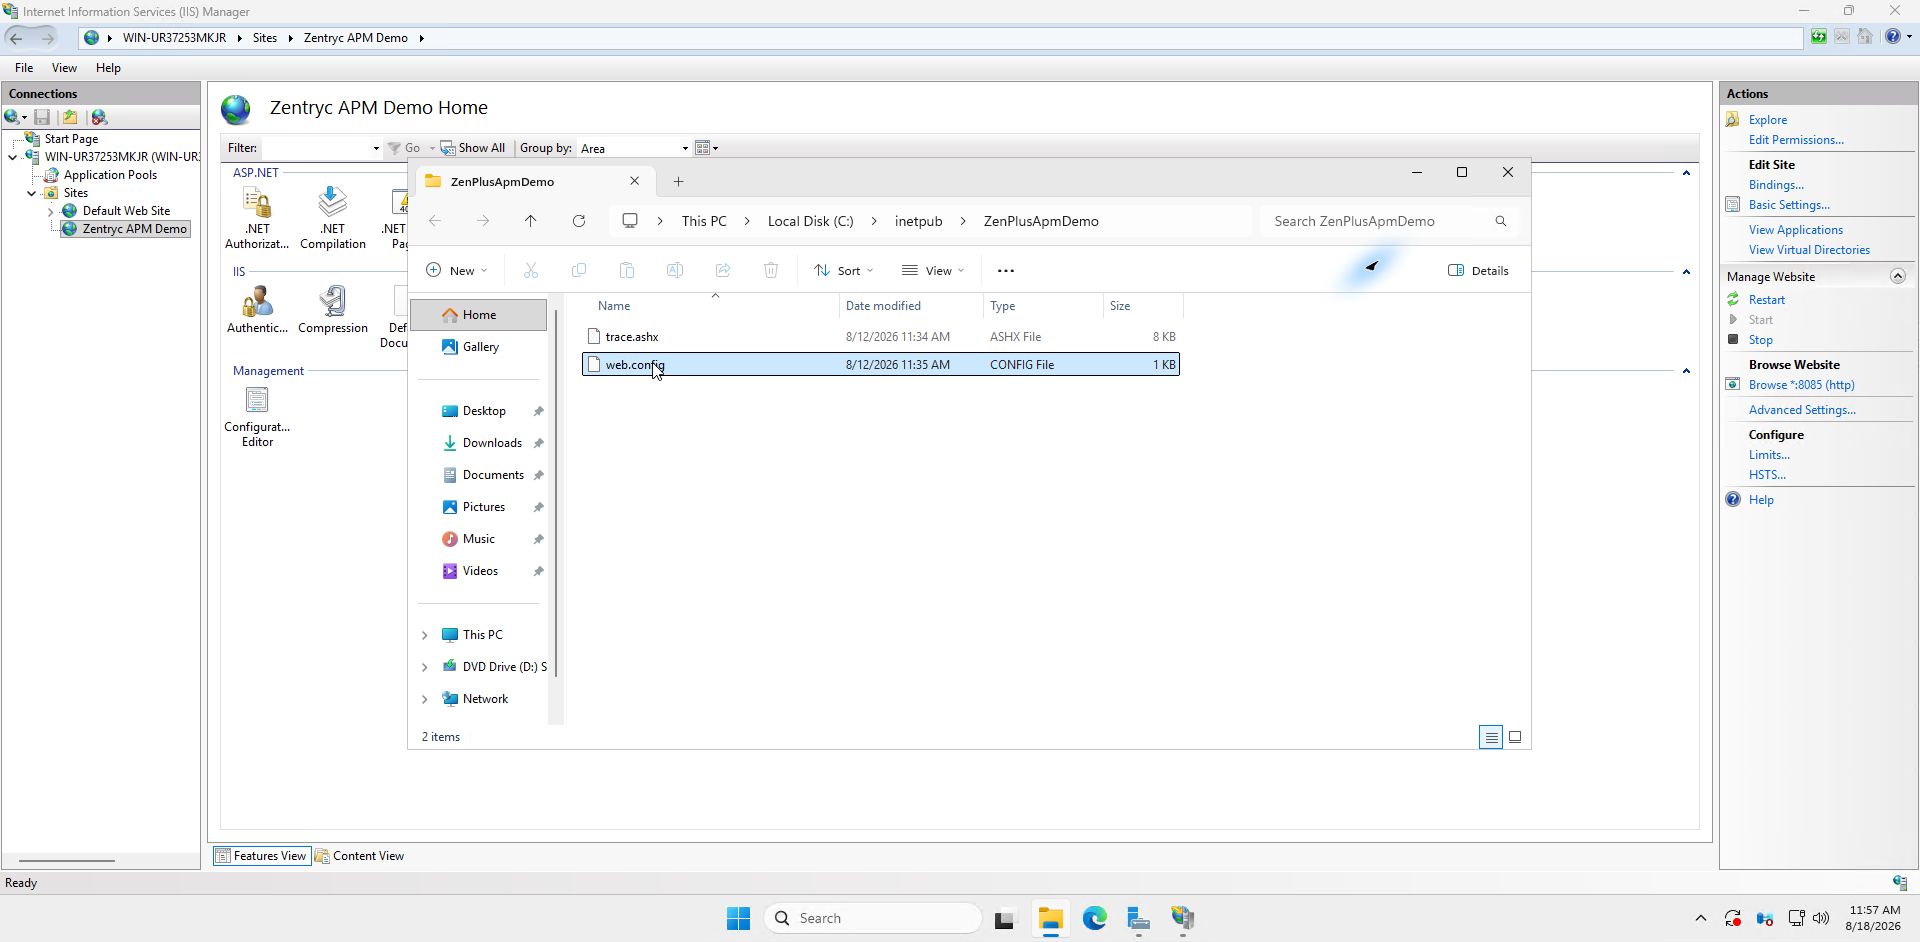
Web.config. The IIS Explore action opens the correct physical folder. The selected web.config file is the application configuration used in the ASP.NET Framework example below.First confirm you selected the application’s own Physical Path. A static-only website may not have one and will not produce application traces. ASP.NET Core deployments normally have a web.config in the published folder, but their OpenTelemetry values belong under <aspNetCore> → <environmentVariables>, not <appSettings>.
2. Confirm the application pool
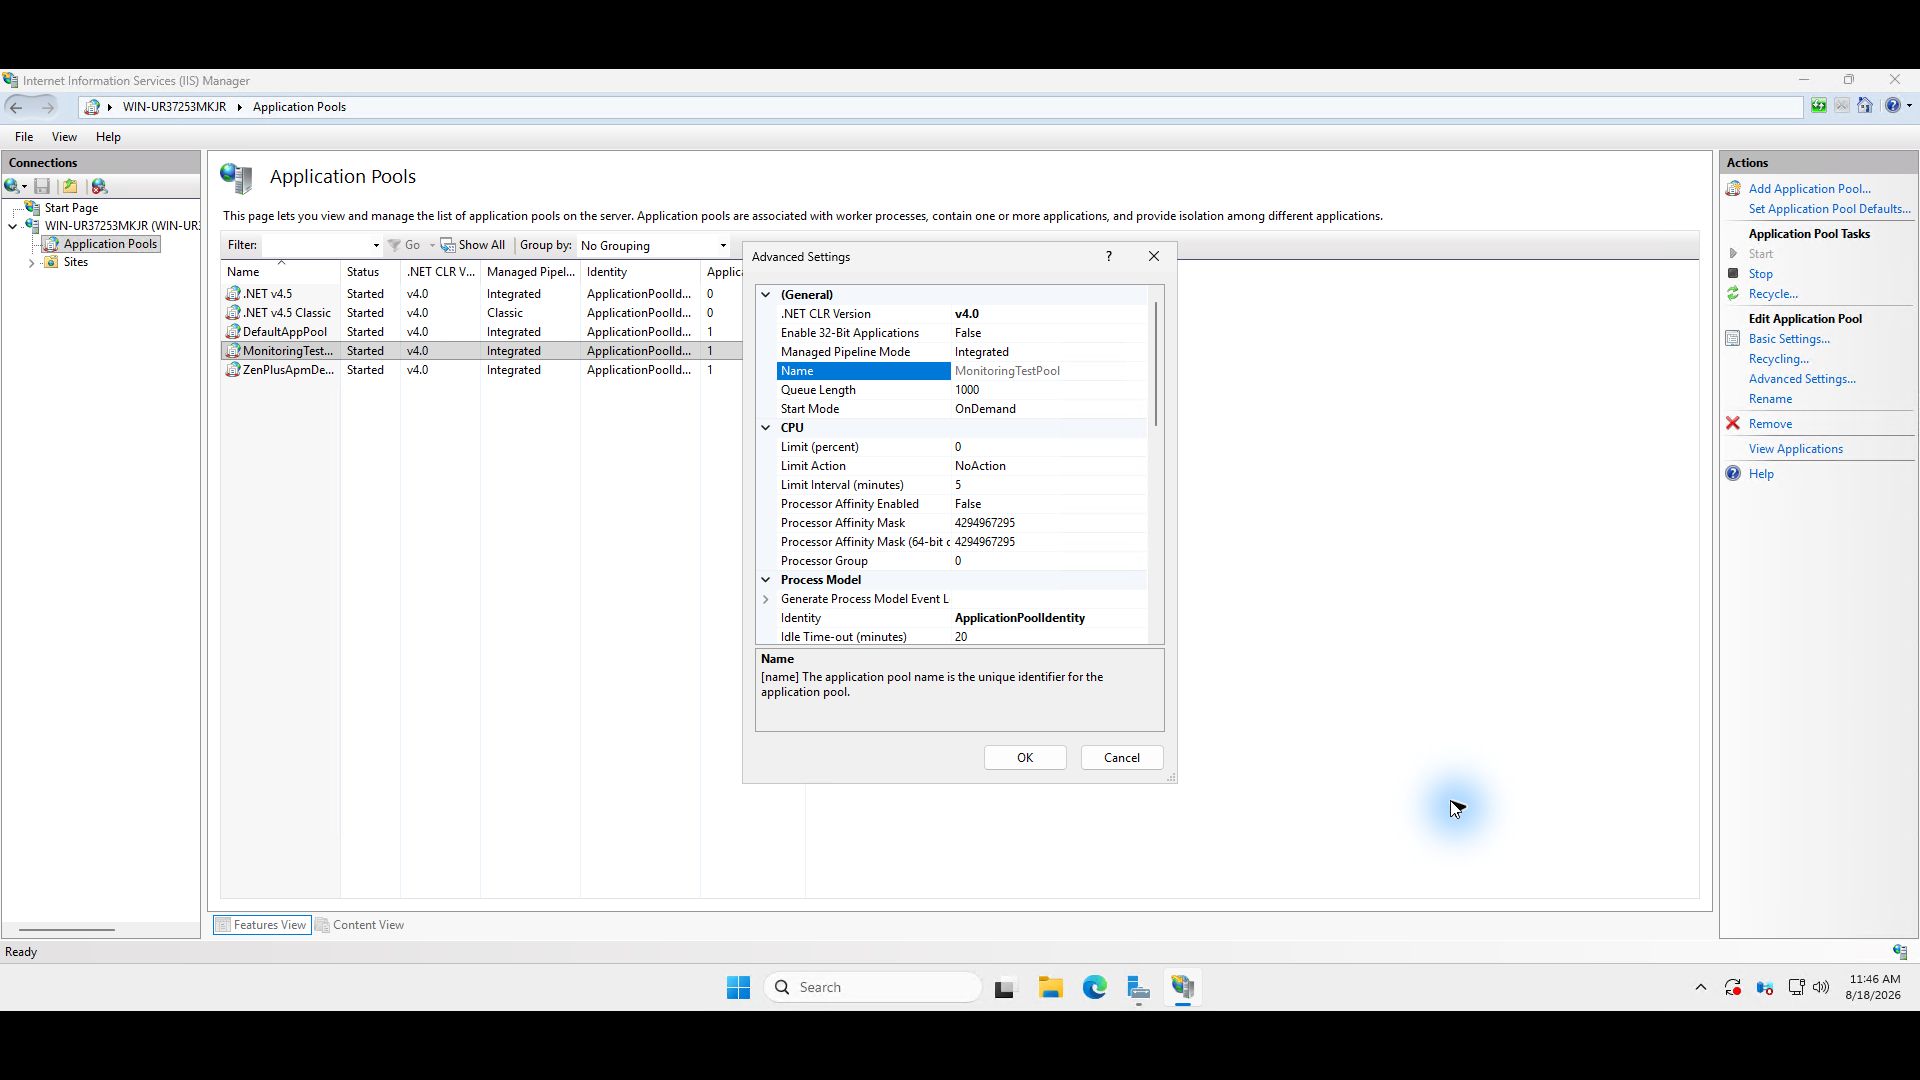
Web.config, not to this dialog. Select the image to open it at full size.Back up Web.config and confirm which application pool serves the site. Use a dedicated pool for each instrumented ASP.NET Framework application.
3. Install OpenTelemetry .NET automatic instrumentation
# Windows PowerShell 5.1 — run as Administrator
$moduleUrl = "https://github.com/open-telemetry/opentelemetry-dotnet-instrumentation/releases/latest/download/OpenTelemetry.DotNet.Auto.psm1"
$modulePath = Join-Path $env:TEMP "OpenTelemetry.DotNet.Auto.psm1"
Invoke-WebRequest -Uri $moduleUrl -OutFile $modulePath -UseBasicParsing
Import-Module $modulePath
Install-OpenTelemetryCore
4. Add the OpenTelemetry values to Web.config
For ASP.NET Framework, merge the following <add> entries into the application’s existing <appSettings> section.
Do not replace the whole file. Do not create a second <configuration> or <appSettings> section. Remove or update an existing key before adding the same key again. Replace the three REPLACE_WITH_... values.
<!-- COPY these entries inside the existing <appSettings> section. -->
<add key="OTEL_SERVICE_NAME"
     value="REPLACE_WITH_SERVICE_NAME" />
<add key="OTEL_TRACES_EXPORTER" value="otlp" />
<add key="OTEL_EXPORTER_OTLP_TRACES_ENDPOINT"
     value="http://127.0.0.1:4318/v1/traces" />
<add key="OTEL_EXPORTER_OTLP_TRACES_PROTOCOL"
     value="http/protobuf" />
<add key="OTEL_METRICS_EXPORTER" value="none" />
<add key="OTEL_LOGS_EXPORTER" value="none" />
<add key="OTEL_RESOURCE_ATTRIBUTES"
     value="deployment.environment.name=REPLACE_WITH_ENVIRONMENT,service.version=REPLACE_WITH_VERSION" />
Exactly what must change
| Key | Example for a real application | Change? |
|---|---|---|
OTEL_SERVICE_NAME | customer-portal | Yes. Unique and stable for each application. |
| Endpoint | http://127.0.0.1:4318/v1/traces | Usually no. Change only if the Agent is not on the IIS server. |
| Protocol | http/protobuf | No. Keep it for port 4318. |
| Environment | prod | Yes. Match the deployment. |
| Service version | 2.4.1 | Yes. Match the deployed release. |
If <appSettings> does not exist
Create one inside the existing <configuration> element, then place the entries above inside it:
<configuration>
  <appSettings>
    <!-- Paste the OTEL <add> entries here. -->
  </appSettings>
  <!-- Keep all other existing sections here. -->
</configuration>Do not use the <appSettings> example for ASP.NET Core. Put the same environment variables inside the existing <aspNetCore> element’s <environmentVariables> section, or configure them on the application pool/service.
5. Register IIS and restart
Import-Module $modulePath
Register-OpenTelemetryForIISRegister-OpenTelemetryForIIS restarts IIS. Schedule the change for a maintenance window on production systems.
6. Generate traffic
Invoke-WebRequest https://your-app.example/health -UseBasicParsingReplace https://your-app.example/health with a real dynamic URL from the application, then open APM → Traces after a few seconds. A separate IIS application pool per application is recommended; on .NET Framework, the first application loaded in a shared pool can determine the OpenTelemetry configuration for that worker process.
06 Nginx, Apache and other common stacks #
Keep the existing Nginx or Apache reverse-proxy configuration. Instrument the application process behind it and send traces to the local Agent gateway.
Python: Django, Flask or FastAPI behind Nginx/Apache
python -m pip install opentelemetry-distro opentelemetry-exporter-otlp-proto-http
opentelemetry-bootstrap -a install

export OTEL_SERVICE_NAME="customer-api"
export OTEL_TRACES_EXPORTER="otlp"
export OTEL_EXPORTER_OTLP_TRACES_ENDPOINT="http://127.0.0.1:4318/v1/traces"
export OTEL_EXPORTER_OTLP_TRACES_PROTOCOL="http/protobuf"
export OTEL_METRICS_EXPORTER="none"
export OTEL_LOGS_EXPORTER="none"
export OTEL_RESOURCE_ATTRIBUTES="deployment.environment.name=prod,service.version=1.0.0"

opentelemetry-instrument gunicorn myproject.wsgi:application
Node.js: Express, NestJS or similar
npm install --save @opentelemetry/api @opentelemetry/auto-instrumentations-node

export OTEL_SERVICE_NAME="web-portal"
export OTEL_TRACES_EXPORTER="otlp"
export OTEL_EXPORTER_OTLP_TRACES_ENDPOINT="http://127.0.0.1:4318/v1/traces"
export OTEL_EXPORTER_OTLP_TRACES_PROTOCOL="http/protobuf"
export OTEL_METRICS_EXPORTER="none"
export OTEL_LOGS_EXPORTER="none"
export NODE_OPTIONS="--require @opentelemetry/auto-instrumentations-node/register"

node server.js
Java: Spring Boot, Tomcat or Jetty
sudo install -d /opt/opentelemetry
sudo curl -L \
  -o /opt/opentelemetry/opentelemetry-javaagent.jar \
  https://github.com/open-telemetry/opentelemetry-java-instrumentation/releases/latest/download/opentelemetry-javaagent.jar

export OTEL_SERVICE_NAME="billing-service"
export OTEL_TRACES_EXPORTER="otlp"
export OTEL_EXPORTER_OTLP_TRACES_ENDPOINT="http://127.0.0.1:4318/v1/traces"
export OTEL_EXPORTER_OTLP_PROTOCOL="http/protobuf"
export OTEL_METRICS_EXPORTER="none"
export OTEL_LOGS_EXPORTER="none"
export JAVA_TOOL_OPTIONS="-javaagent:/opt/opentelemetry/opentelemetry-javaagent.jar"| Web tier | Instrument this | What ZenPlus can show |
|---|---|---|
| IIS | ASP.NET / .NET runtime | HTTP requests, .NET exceptions, supported HTTP and SQL dependencies |
| Nginx | Node.js, Python, Java, PHP or other upstream runtime | Application requests and downstream calls |
| Apache HTTP Server | Application runtime or module behind Apache | Application requests and downstream calls |
| Tomcat / Jetty | JVM with the Java Agent | Servlet requests, JDBC, HTTP clients and supported frameworks |
07 Direct-to-appliance mode #
Use direct mode only when an Agent cannot run on the application host.
- Open Applications → Settings → Ingest keys.
- Create an SDK key for the correct environment.
- Copy it immediately; the plaintext key is shown once.
- Set the appliance URL and authorization header in the application runtime.
export OTEL_SERVICE_NAME="orders-api"
export OTEL_TRACES_EXPORTER="otlp"
export OTEL_EXPORTER_OTLP_TRACES_ENDPOINT="https://zenplus.example/v1/traces"
export OTEL_EXPORTER_OTLP_TRACES_PROTOCOL="http/protobuf"
export OTEL_EXPORTER_OTLP_HEADERS="Authorization=Bearer zpi_REPLACE_WITH_KEY"
export OTEL_METRICS_EXPORTER="none"
export OTEL_LOGS_EXPORTER="none"Store direct-mode keys in a secret manager or protected service environment. Never commit them to source control, bake them into an image, or place them in client-side JavaScript.
08 Verify and troubleshoot #
Successful result
- Send several normal requests, one slow request and—only in a test environment—one controlled error.
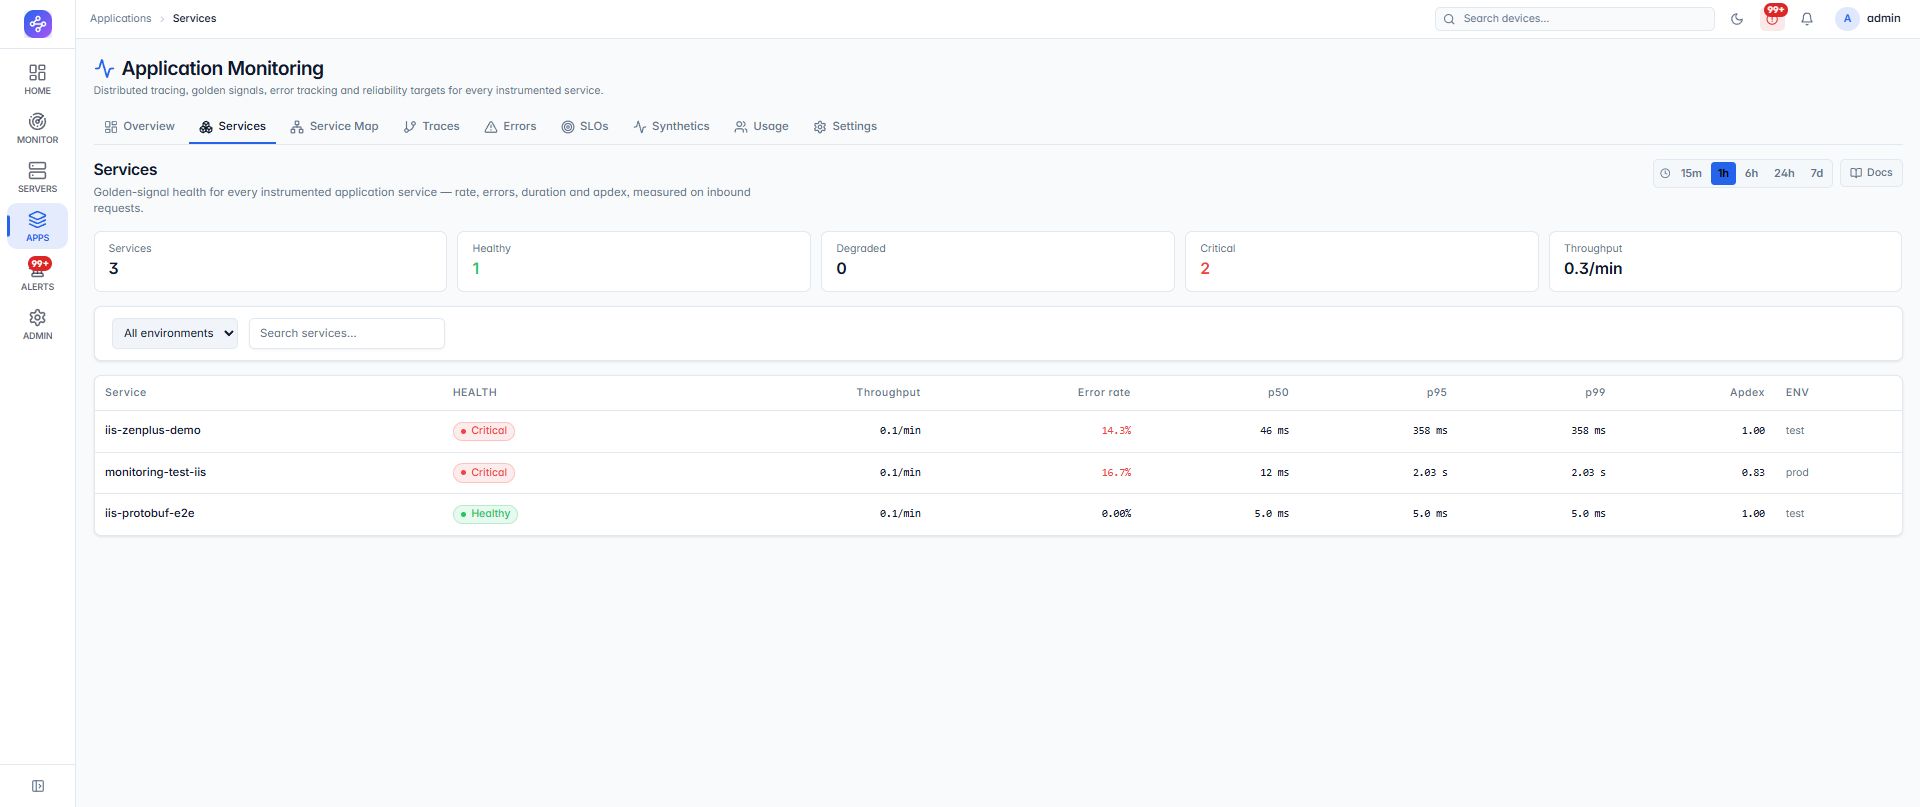
- Open Applications → Services and select a 15-minute or 1-hour window.
- Confirm the service name, environment, throughput, error rate and latency.
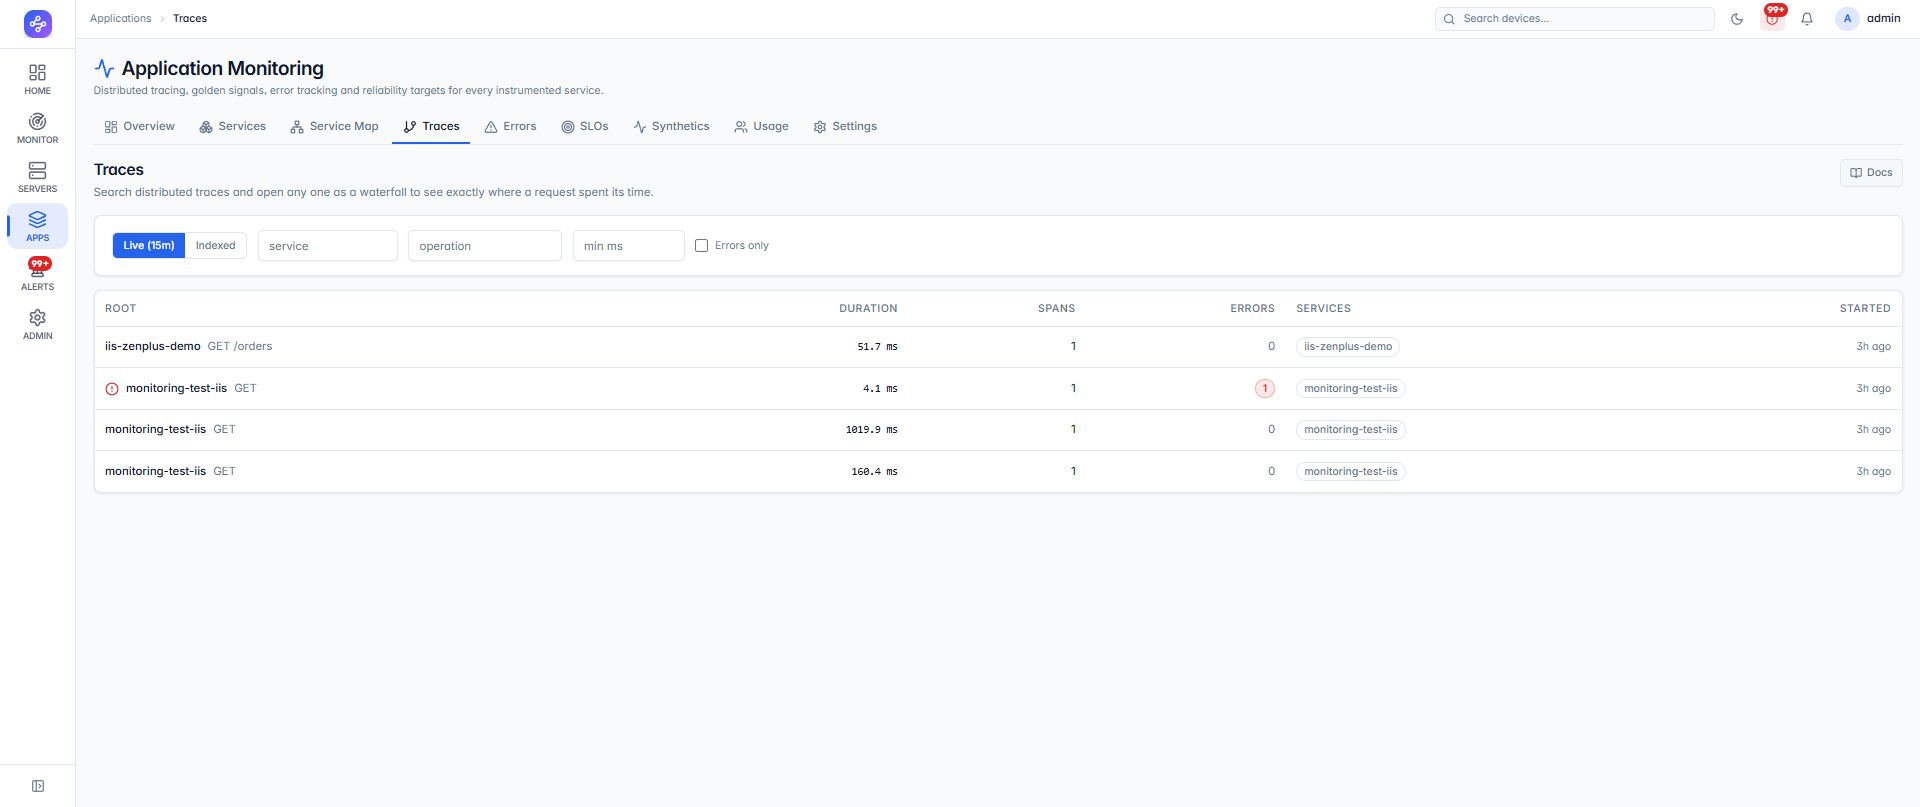
- Open Traces and select a request to inspect its waterfall.
If the screen is empty
| Check | Expected result | If it fails |
|---|---|---|
| Application received traffic | A real application URL returned a response. | Do not test only a static HTML file; exercise the instrumented runtime. |
| Agent gateway | 127.0.0.1:4318 is listening. | Enable APM and restart the ZenPlus Agent. |
| Protocol | http/protobuf | Do not use gRPC against an HTTP endpoint. |
| Endpoint | Agent: http://127.0.0.1:4318/v1/traces | Correct the runtime environment or service configuration. |
| Service restart | Application worker restarted after configuration. | Recycle the IIS pool or restart the application service. |
| Time window | 15 minutes or 1 hour includes the test request. | Widen the window and refresh. |
| Direct-mode key | Ingest key shows recent use. | Correct the authorization header or create a new SDK key. |
APM traces cover application requests, latency, failures and supported dependencies. The ZenPlus Agent separately covers host infrastructure. Add manual OpenTelemetry spans for important business operations that automatic instrumentation cannot see.